Follow the service journey
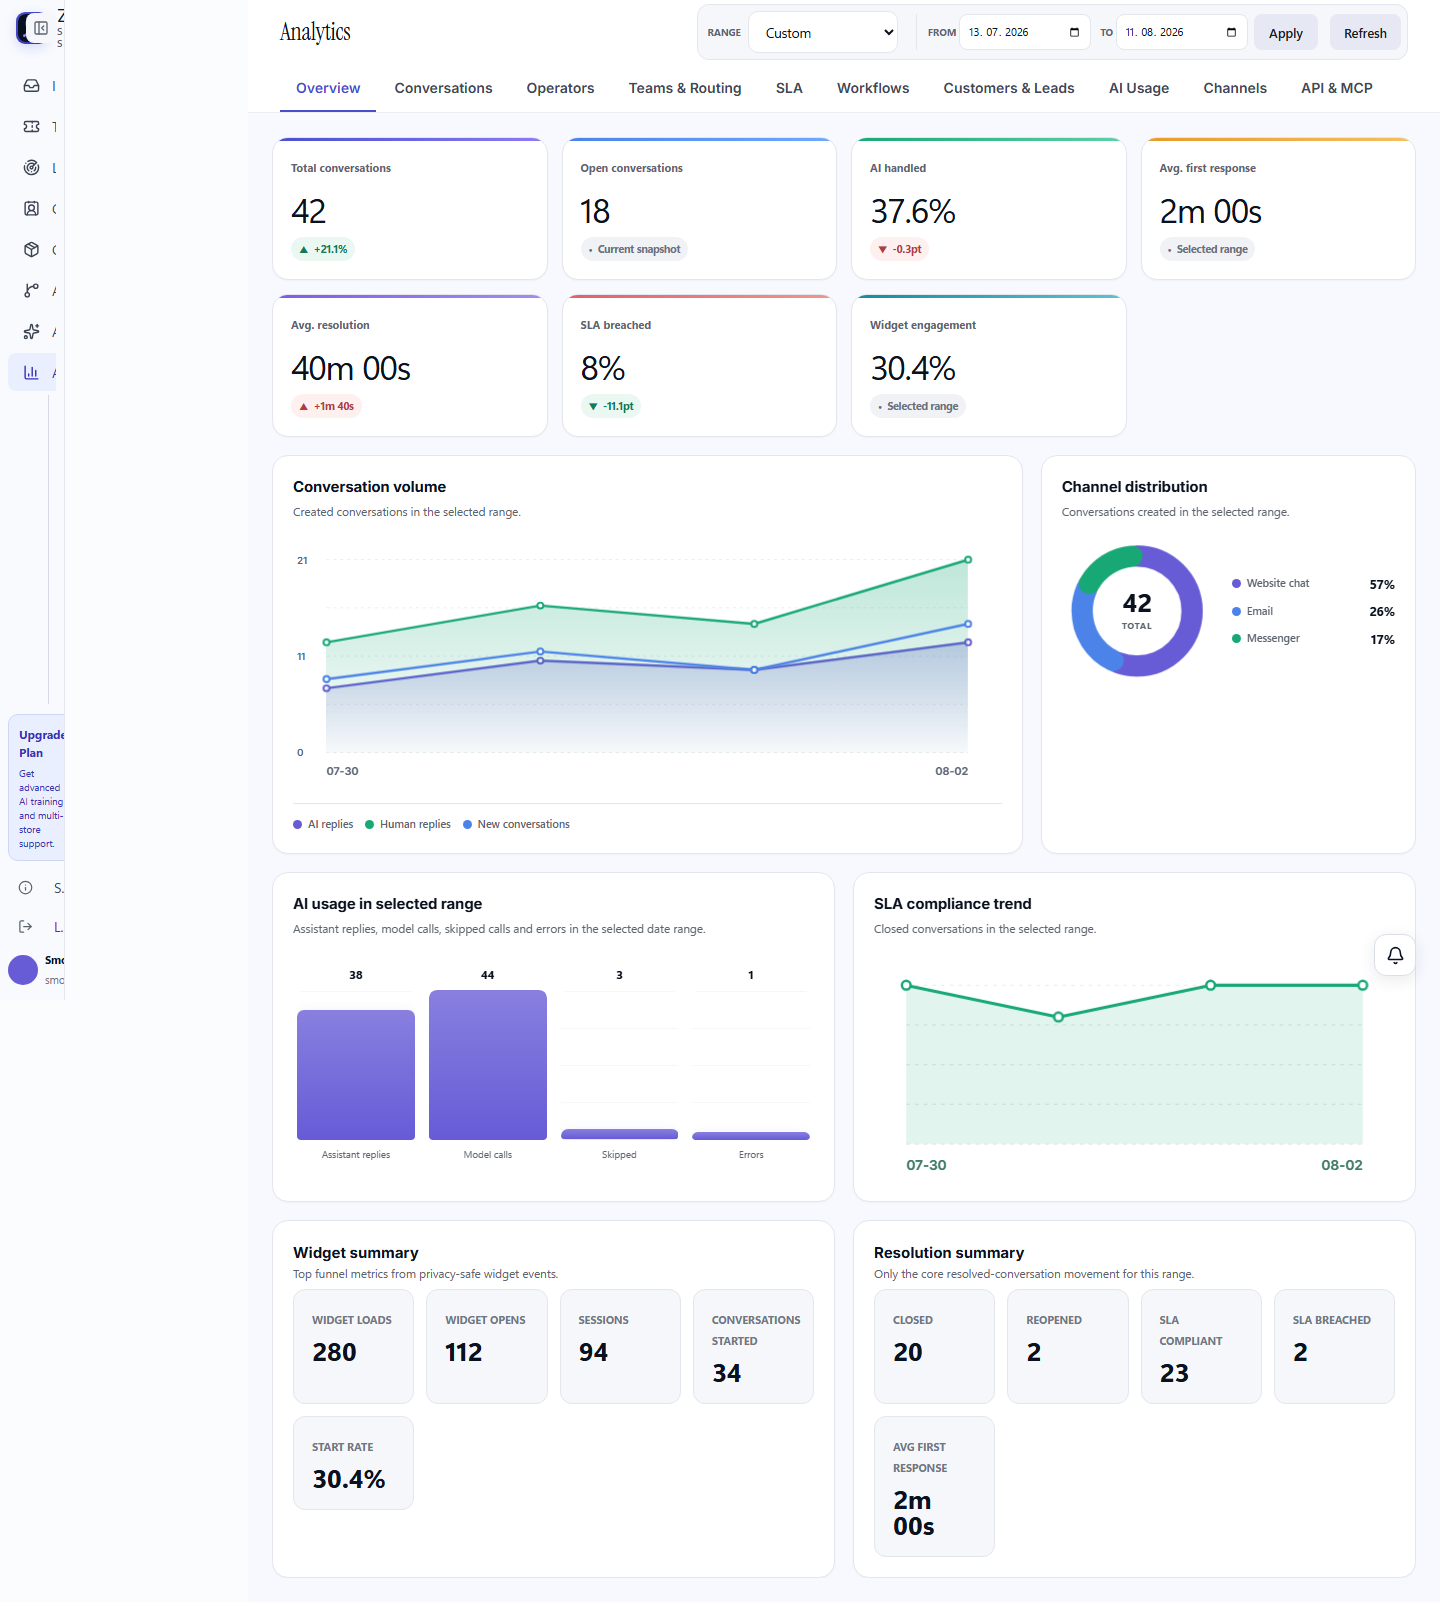
Review conversation volume, first-response performance, resolution time, status movement, and SLA outcomes across selected date ranges.
- Response and resolution trends
- SLA status and breaches
- Conversation outcome breakdowns
See where work originates
Channel and widget analytics show how customers reach the team, while visitor and attribution context can connect support activity to the storefront journey.
- Channel distribution
- Widget and visitor signals
- Bounded date-range reporting
Measure AI and workflow involvement
Track where AI and automations participate, inspect execution outcomes, and use job visibility to distinguish product behavior from provider or queue failures.
- AI involvement
- Workflow execution signals
- Operational job visibility
Related ZoeRelay capabilities
Frequently asked questions
Which support metrics are available?
ZoeRelay includes conversation, response, resolution, SLA, channel, widget, AI involvement, workflow, and workload views.
Can reports use a custom date range?
Supported analytics views accept bounded date ranges so queries remain predictable for each workspace.
Does a chart prove production capacity?
No. Product analytics describe workspace activity; release capacity and live infrastructure health require separate operational evidence.